30 Maps in 30 Days
with Python
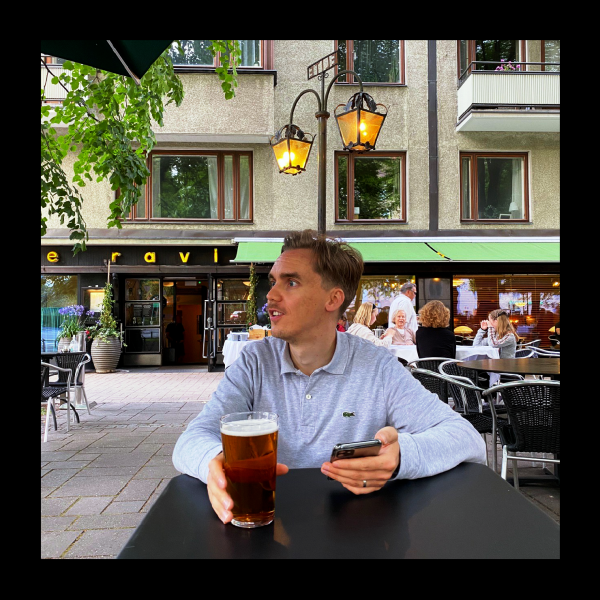
Alexander Kmoch

Research Fellow
Department of Geography
University of Tartu, Estonia
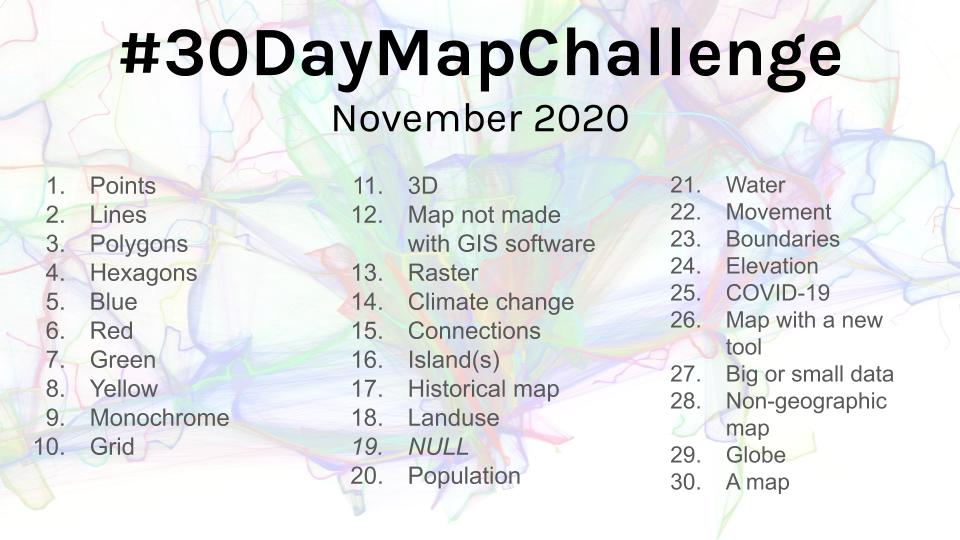
Topi & Challenge
Map themes
Concepts
Libraries
Lessons learned
Topi Tjukanov
Topi Tjukanov

https://twitter.com/hashtag/30DayMapChallenge
Somebody even made an inventory
https://david.frigge.nz/30DayMapChallenge2020/
2019: at least 631 people tweeting on the hashtag / indexed 3484 maps by 414 people. - 25 people creating all 30 maps
2020: at least 1378 people tweeting on the hashtag. / indexed 6882 maps by 797 people. - 67 people creating all 30 maps
Geospatial Python and Pyviz FTW
https://allixender.github.io/30MapChallenge2020/
Github repo
Sphinx :-)
Notebooks + (most) data, at least data cites
reproducible
Challenges
Idea + Data + Skill → Good Map
Open Data related to themes (cool idea?)
Too much/big data hard to effectively churn into a nice map
Styling options (existing vs. known vs. skill)
Concepts
data acquisition
pre-processing
spatial analysis (sometimes)
plotting and styling
Libraries and how I used them
produce the image
Geopandas.plot aka Matplotlib - 11
GeoPlot - 5
GeoViews / cartopy - 4
EarthPy - 4
Python PILLOW, raw image/gifs - 3
Datashader - 2
folium - 1
Libraries and how I used them
data acquisition and pre-processing
Geopandas
Rasterio/GDAL
Contextily (as a basemap)
requests / urllib.requests
Owslib
osmnx
Libraries and how I used them
spatial analysis
Shapely/Geopandas clip, sjoin or otherwise subselect - 7
Pysal (MapClassify) - 6
GeoPlot functions (KDE, cartogram) - 4
EarthPy (Hillshade) - 3
DGGS grids - 3
pysheds - 1
idw_knn interpolation - 1
pymannkendall - 1
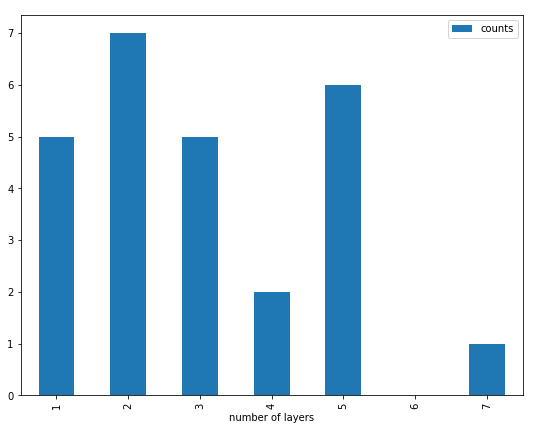
Libraries and how I used them
number of layers

Classic Points: Estonian State Forest Management Centre (RMK) public recreations sites
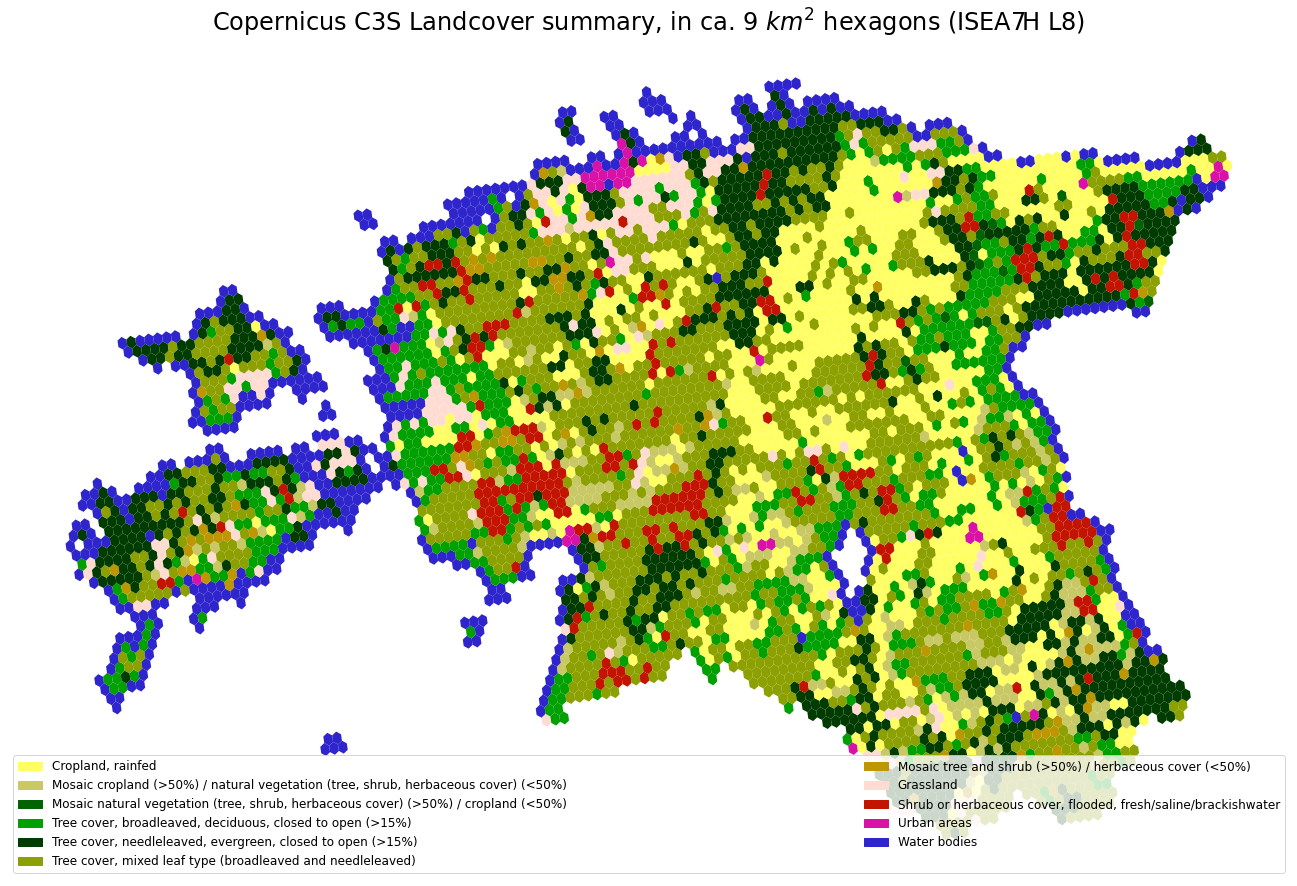
Classic GIS: Landuse Copernicus C3S Landcover for Estonia
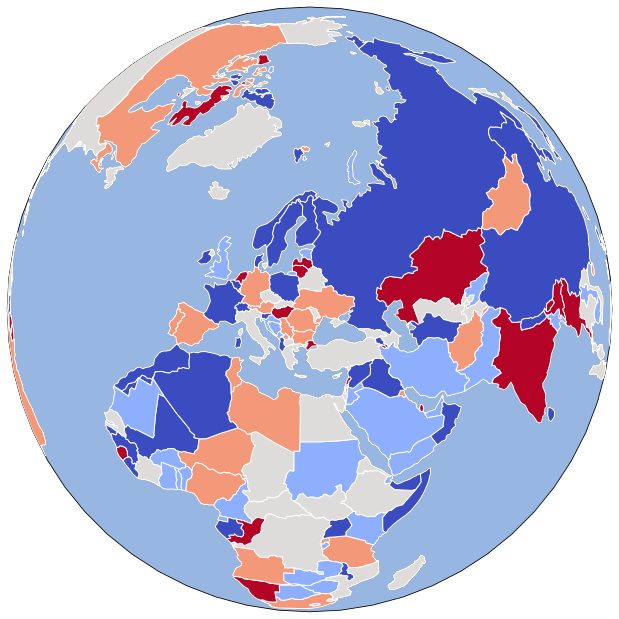
Natural Earth population as Globe with GeoViews

Hexagons: NASA GPWv4 global population density in ISEAH7 DGGS Hexagons
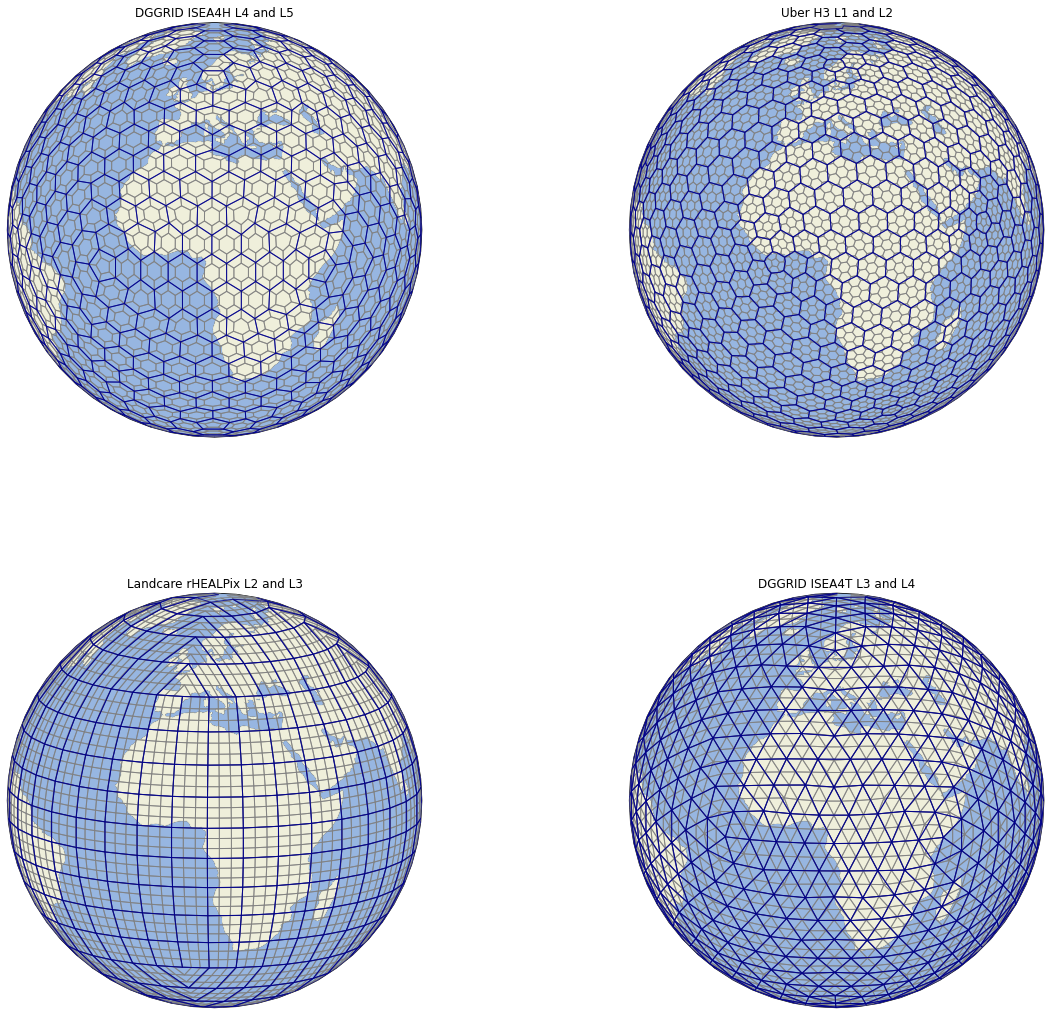
Grids - comparison of different global grid systems (H3, rHealPix, dggrid4py)
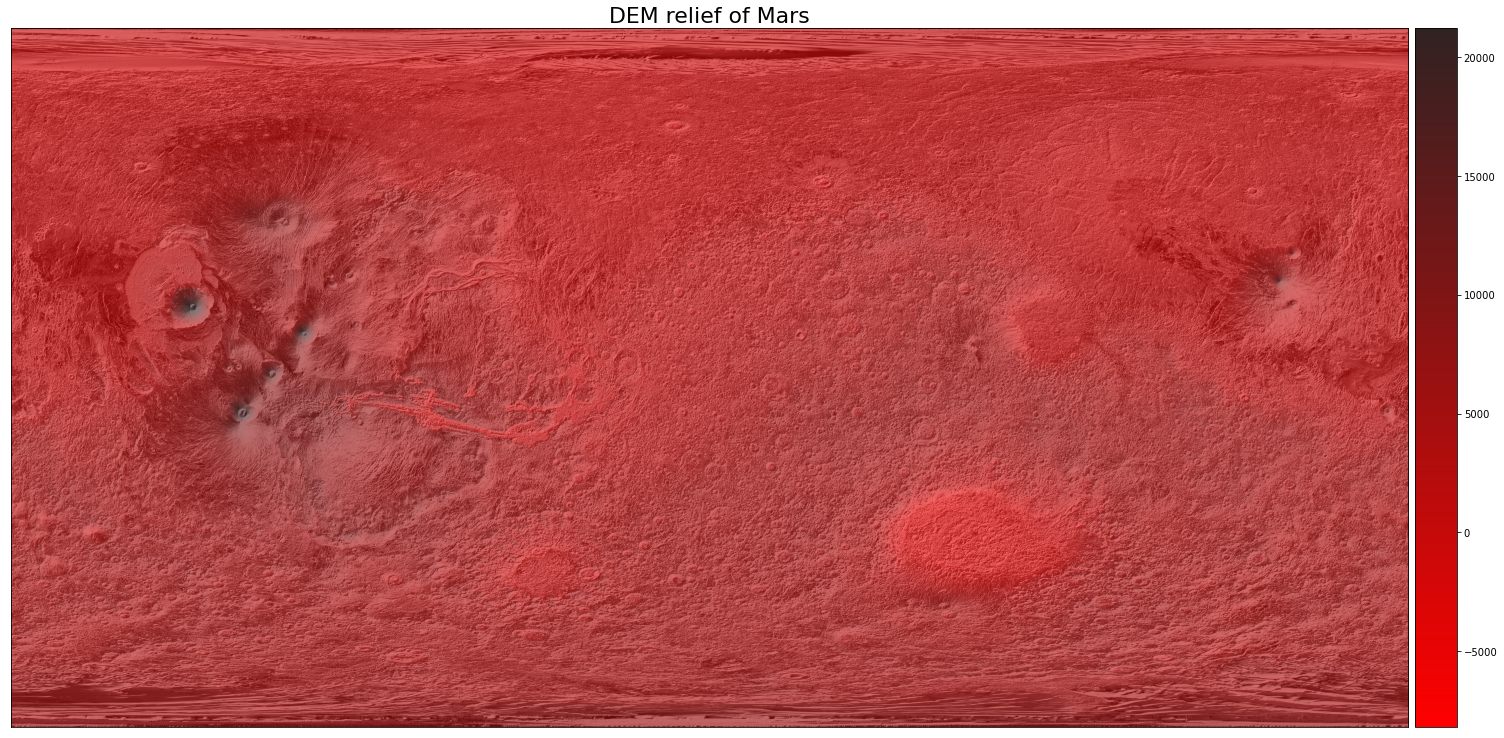
Red DEM shading of Mars (EarthPy)
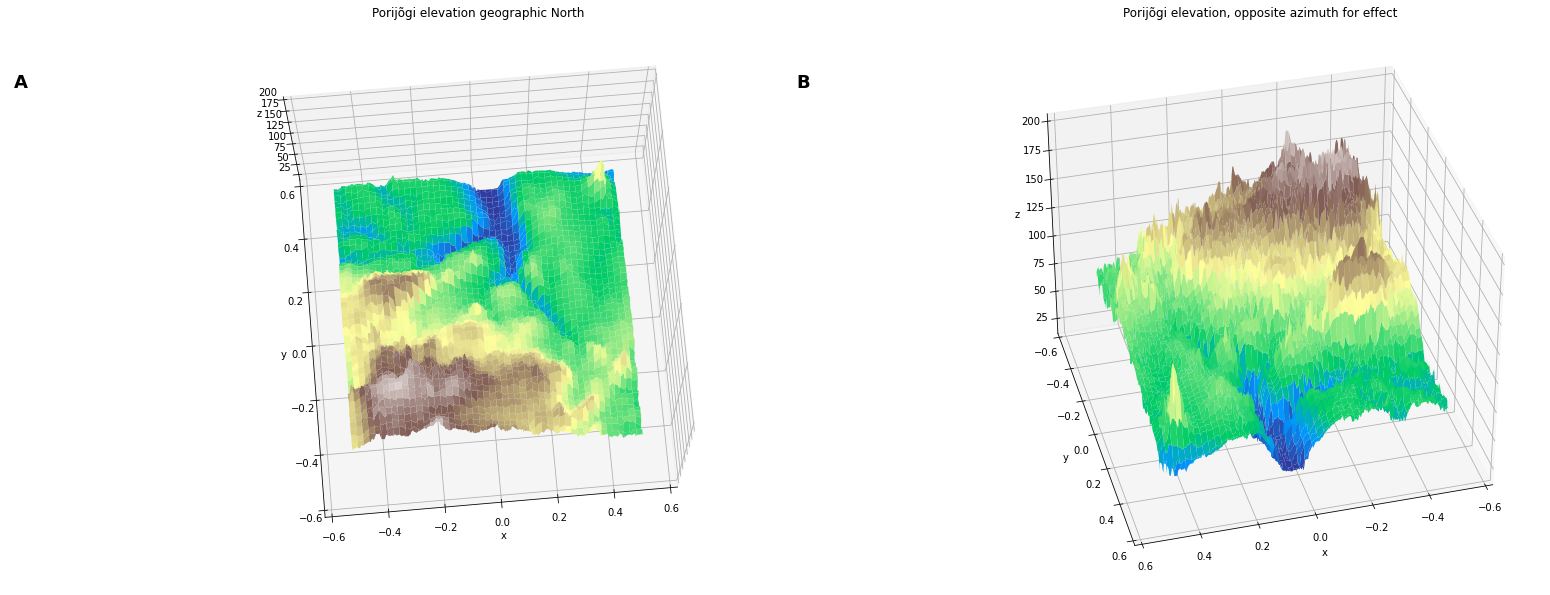
3D Elevation as scientific surface plot
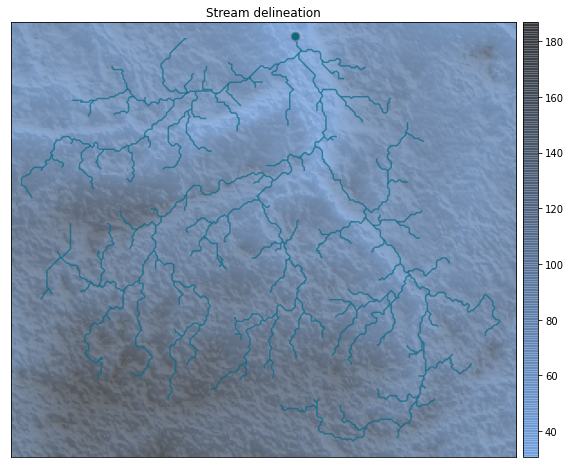
Monochrome theme: Stream Delineation with PySheds
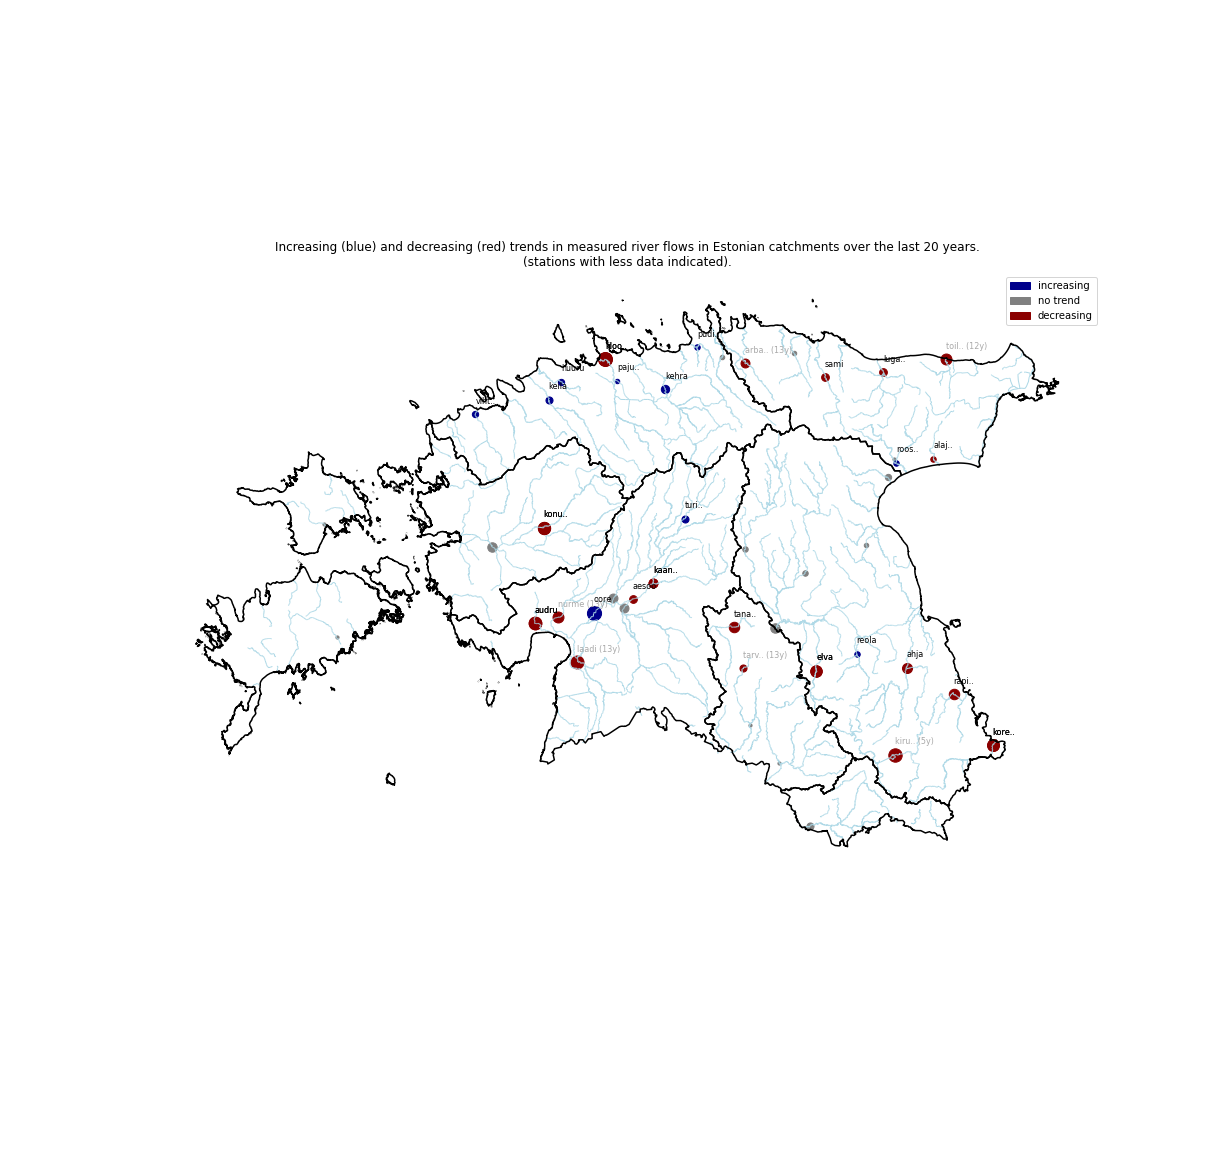
Trends in River flows in Estonia (pymannkendall)
Change of Sea ice extent around Antarctica Nov. 2020

Historical Maps of the Estonian Island of Vormsi - Owslib WMS
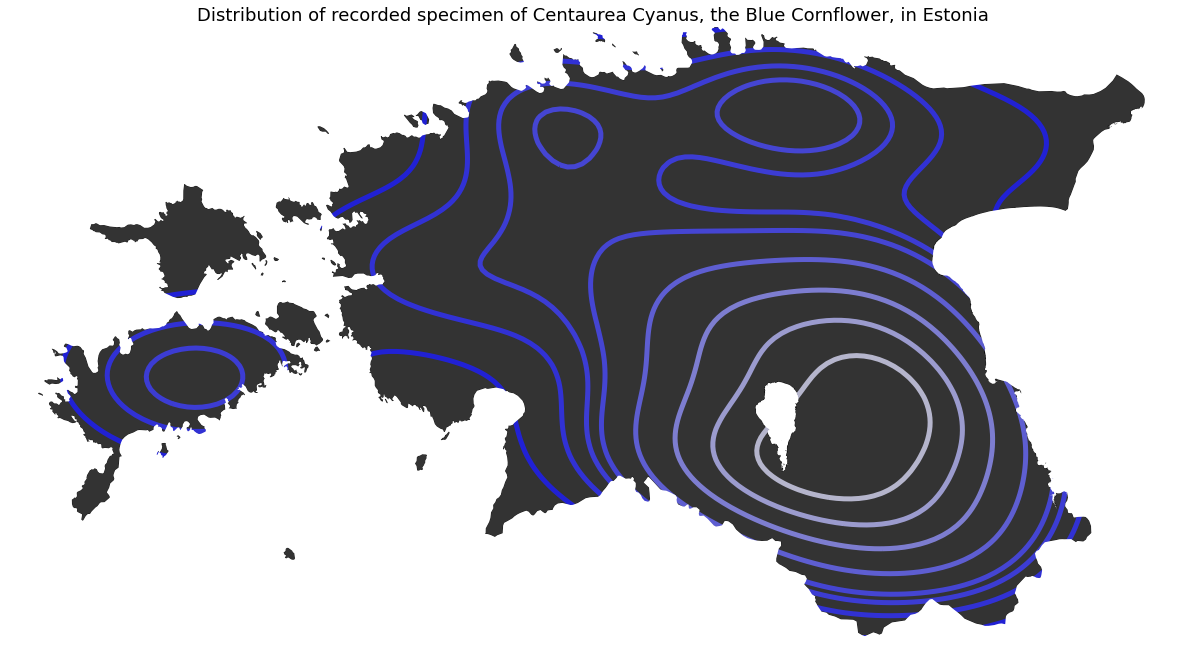
GeoPlot KDE - Blue Cornflower distribution
The Blue Cornflower is also a National Estonian symbol.
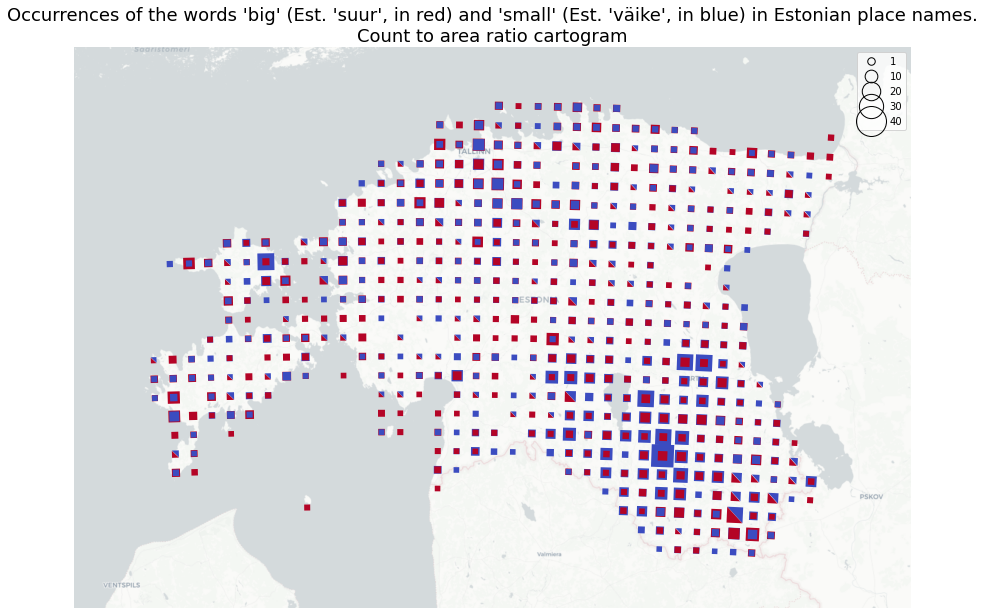
Big or (and) small: Place names containing big / small
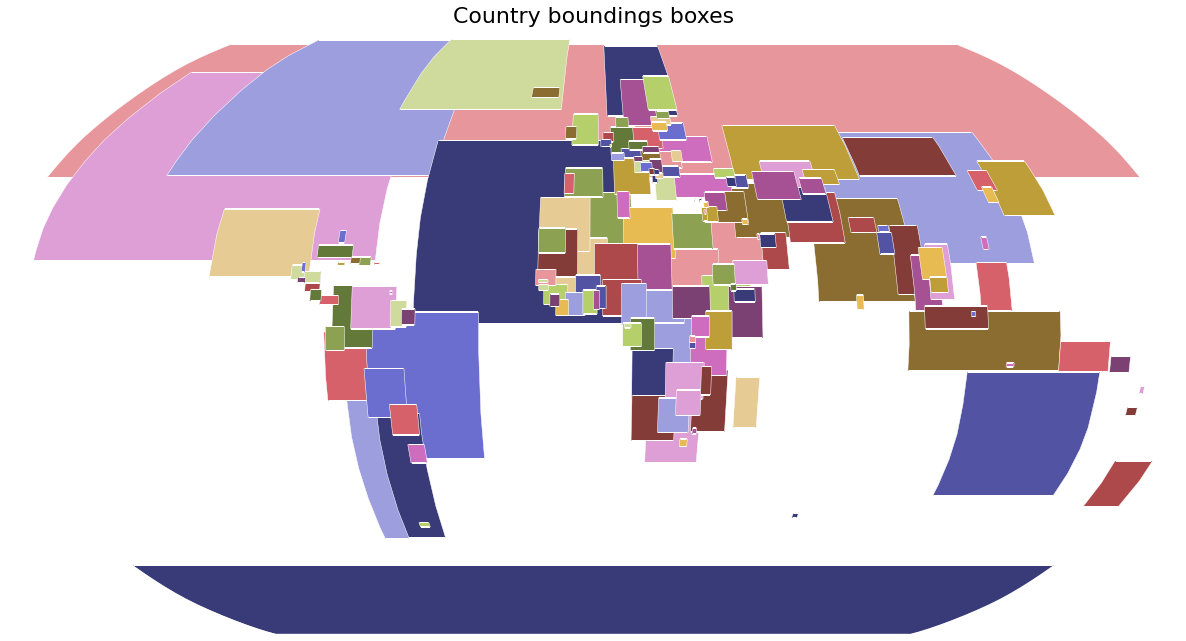
GeoPlot Cartograms: Boundaries as global countries bboxes
Day 26 - Map with a new tool
#TODO
Day 28 - Non-geographic map
#TODO
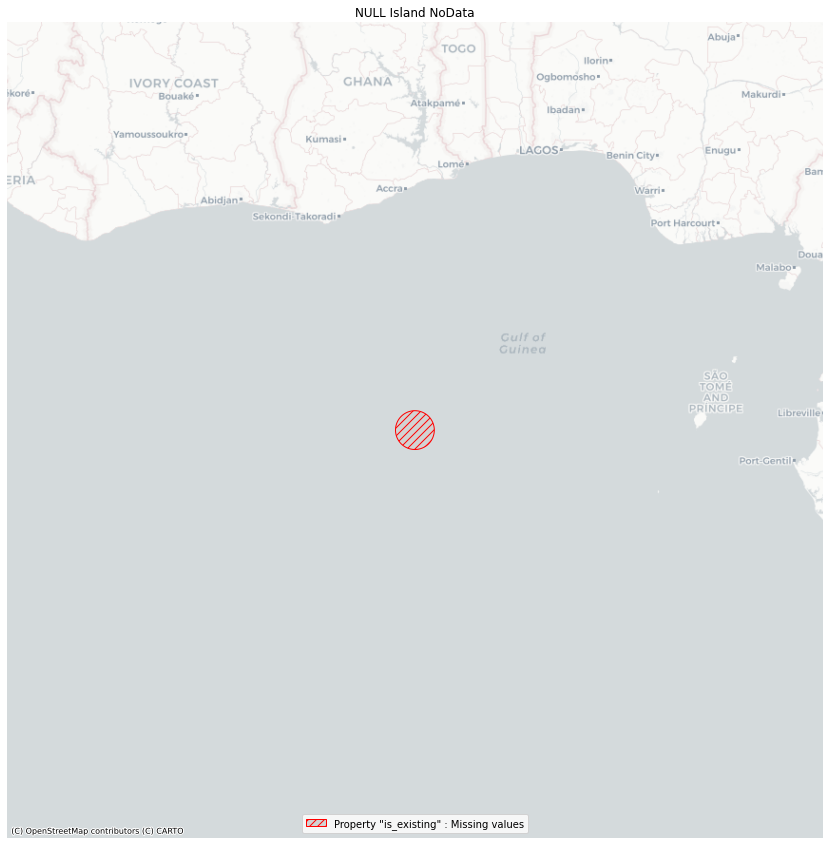
NULL Island NoData

Datashader: Estonian rivers and streams by from Estonian Landboard (Maa-Amet)
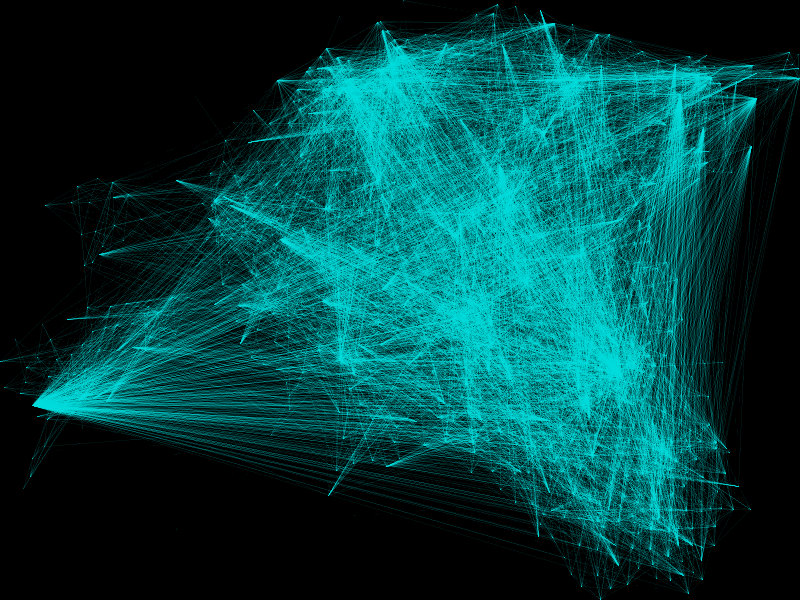
Datashader - Movement / Mobility in Estonia
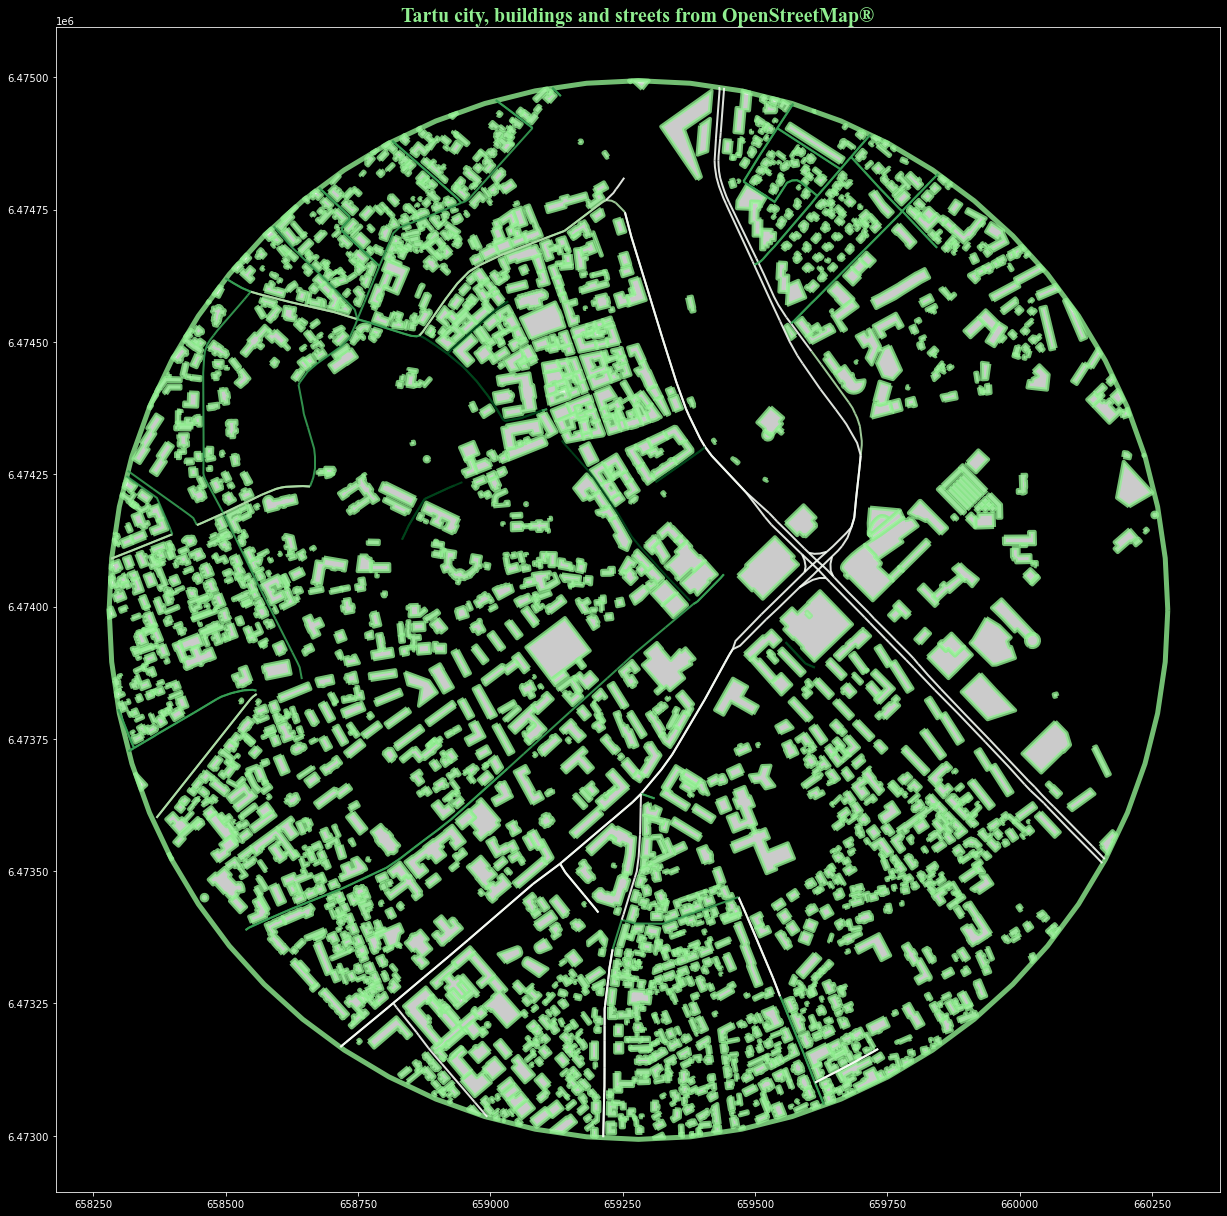
Green Radar Style Buildings Footprint (OSMNX)
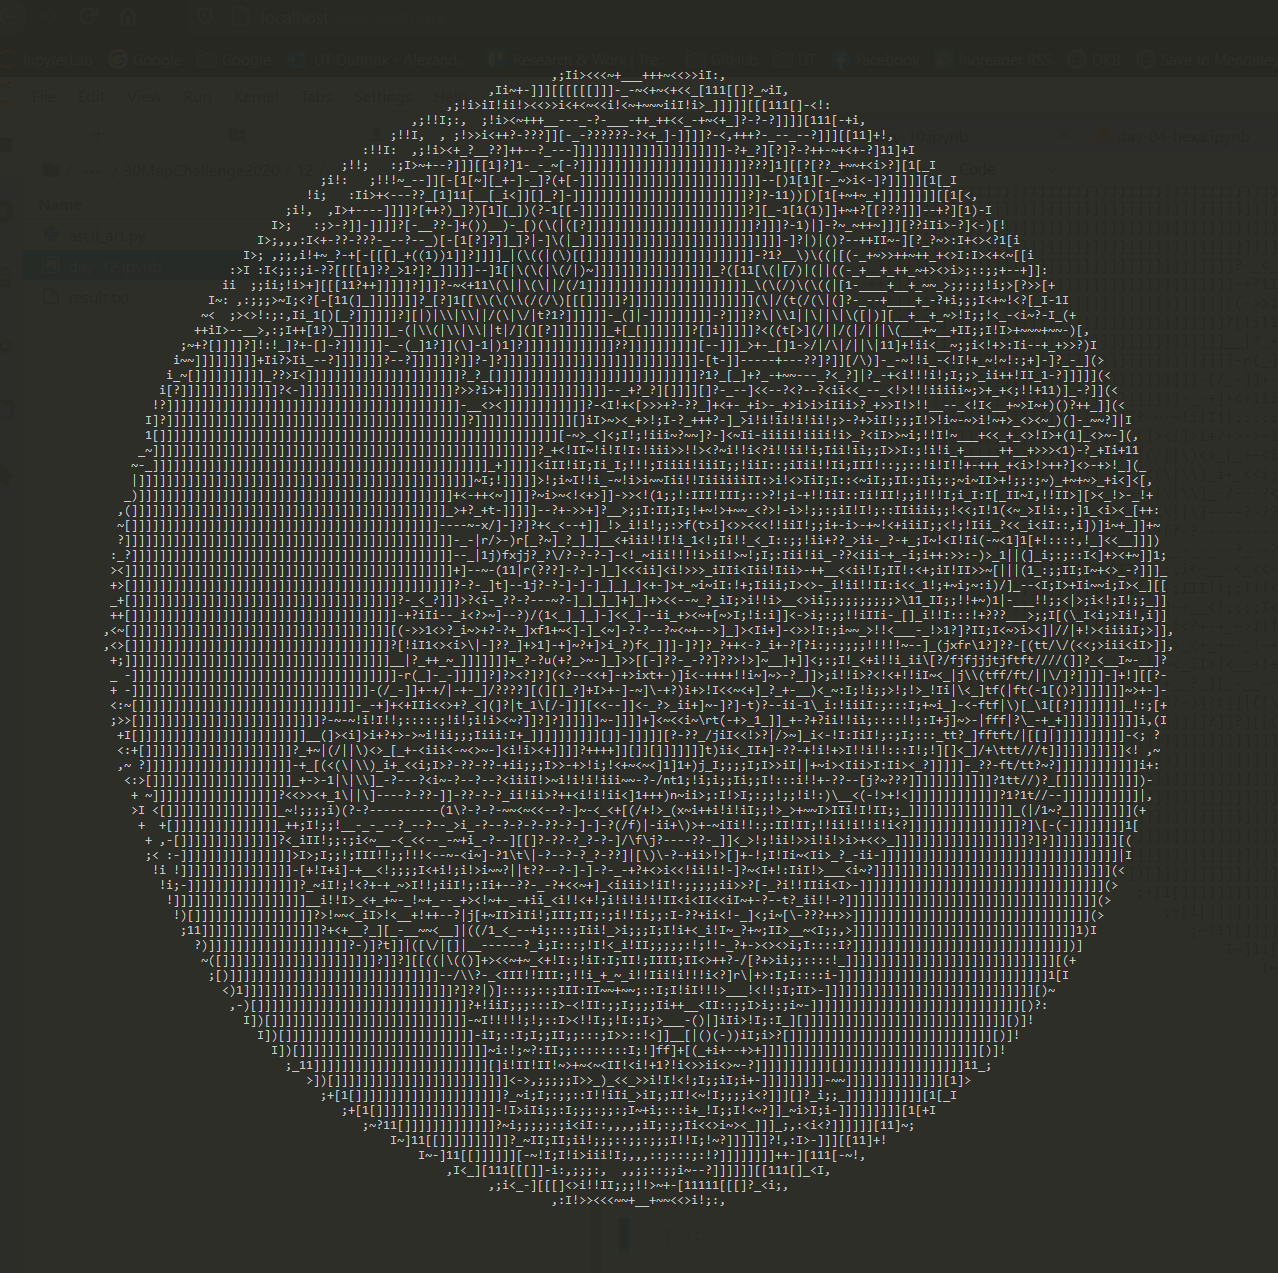
Map not made with GIS software (ASCII art)
Conclusions
It was awesome!
It was slightly insane.
I learned sooo much!
Gotta do it again.
Thanks.
twitter.com/allixender
twitter.com/lgeoinformatics